
Analytics
The screen brings the whole picture together on one page: how many people use the app, how activity changes day by day, what devices shoppers come from, how sales and orders move and how push campaigns perform.
Part of the report is built on data from external services:
- A mobile analytics service covers users, sessions, crashes and distributions.
- A push delivery service covers the Push notifications block.
Until a service is connected, an invitation to set it up is shown instead of the report. Connecting is done in Integrations.
The Sales and orders block and the operational summaries are built from the shop's own data and always work.
How to open it
The rail, the Growth group, Analytics. The "All analytics and charts for the period" link on the Today screen leads here too.
What you can do
- Watch current user activity: DAU, WAU, MAU
- Watch revenue, orders and customer registrations day by day
- Track new installs, sessions and crashes over a period
- Compare a period with the one before it
- See any metric plotted by day
- See how users are spread across operating systems and app versions
- Keep an eye on push subscribers and recent campaign results
Choosing a period
In the top right is the period switch: 7 days, 30 days, 90 days. It affects the "For the period" block, the trend chart and the distributions. The "Right now" block does not depend on the period.
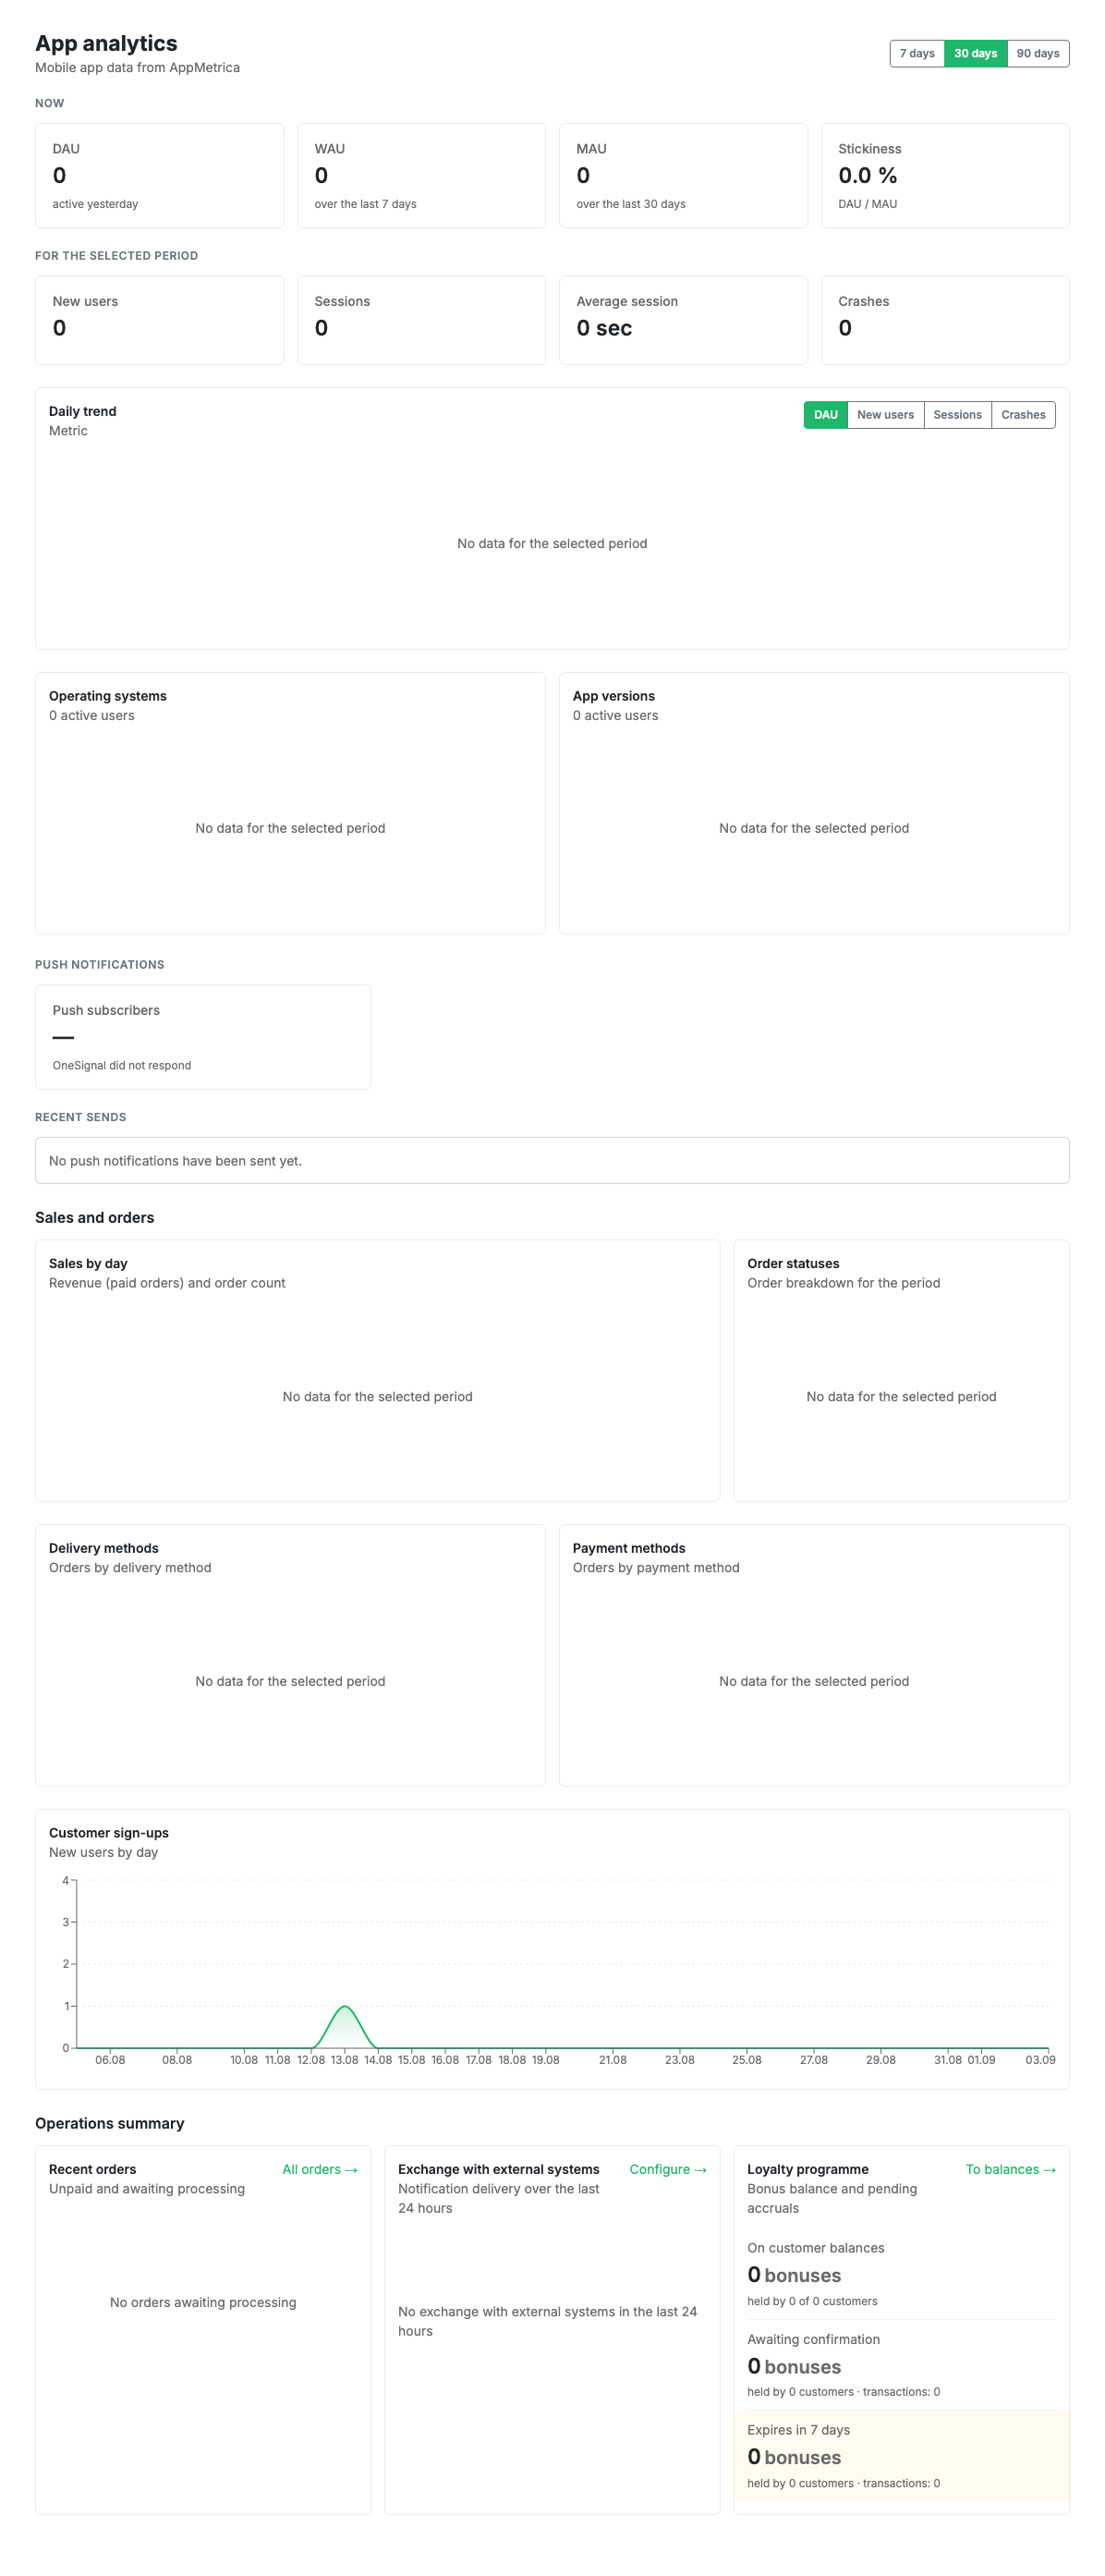
The interface
The "Right now" block
A snapshot of activity at this moment. The period does not affect these figures.
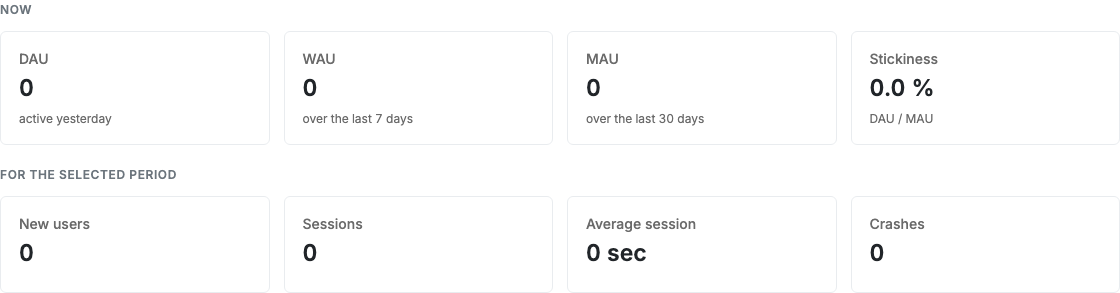
- DAU: unique users yesterday.
- WAU: unique users over the last 7 days.
- MAU: unique users over the last 30 days.
- Stickiness: DAU divided by MAU, as a percentage. It shows how often people come back: the higher it is, the more habitual the app.
The "For the period" block
Figures for the period from the switch. Each carries an arrow with the change against the previous period of the same length.
- New users: how many people installed the app for the first time.
- Sessions: how many times the app was opened.
- Average session: how long a visit lasts on average.
- Crashes: how many times the app terminated abnormally. Here growth is bad, so an upward arrow is highlighted negatively.
Trend by day
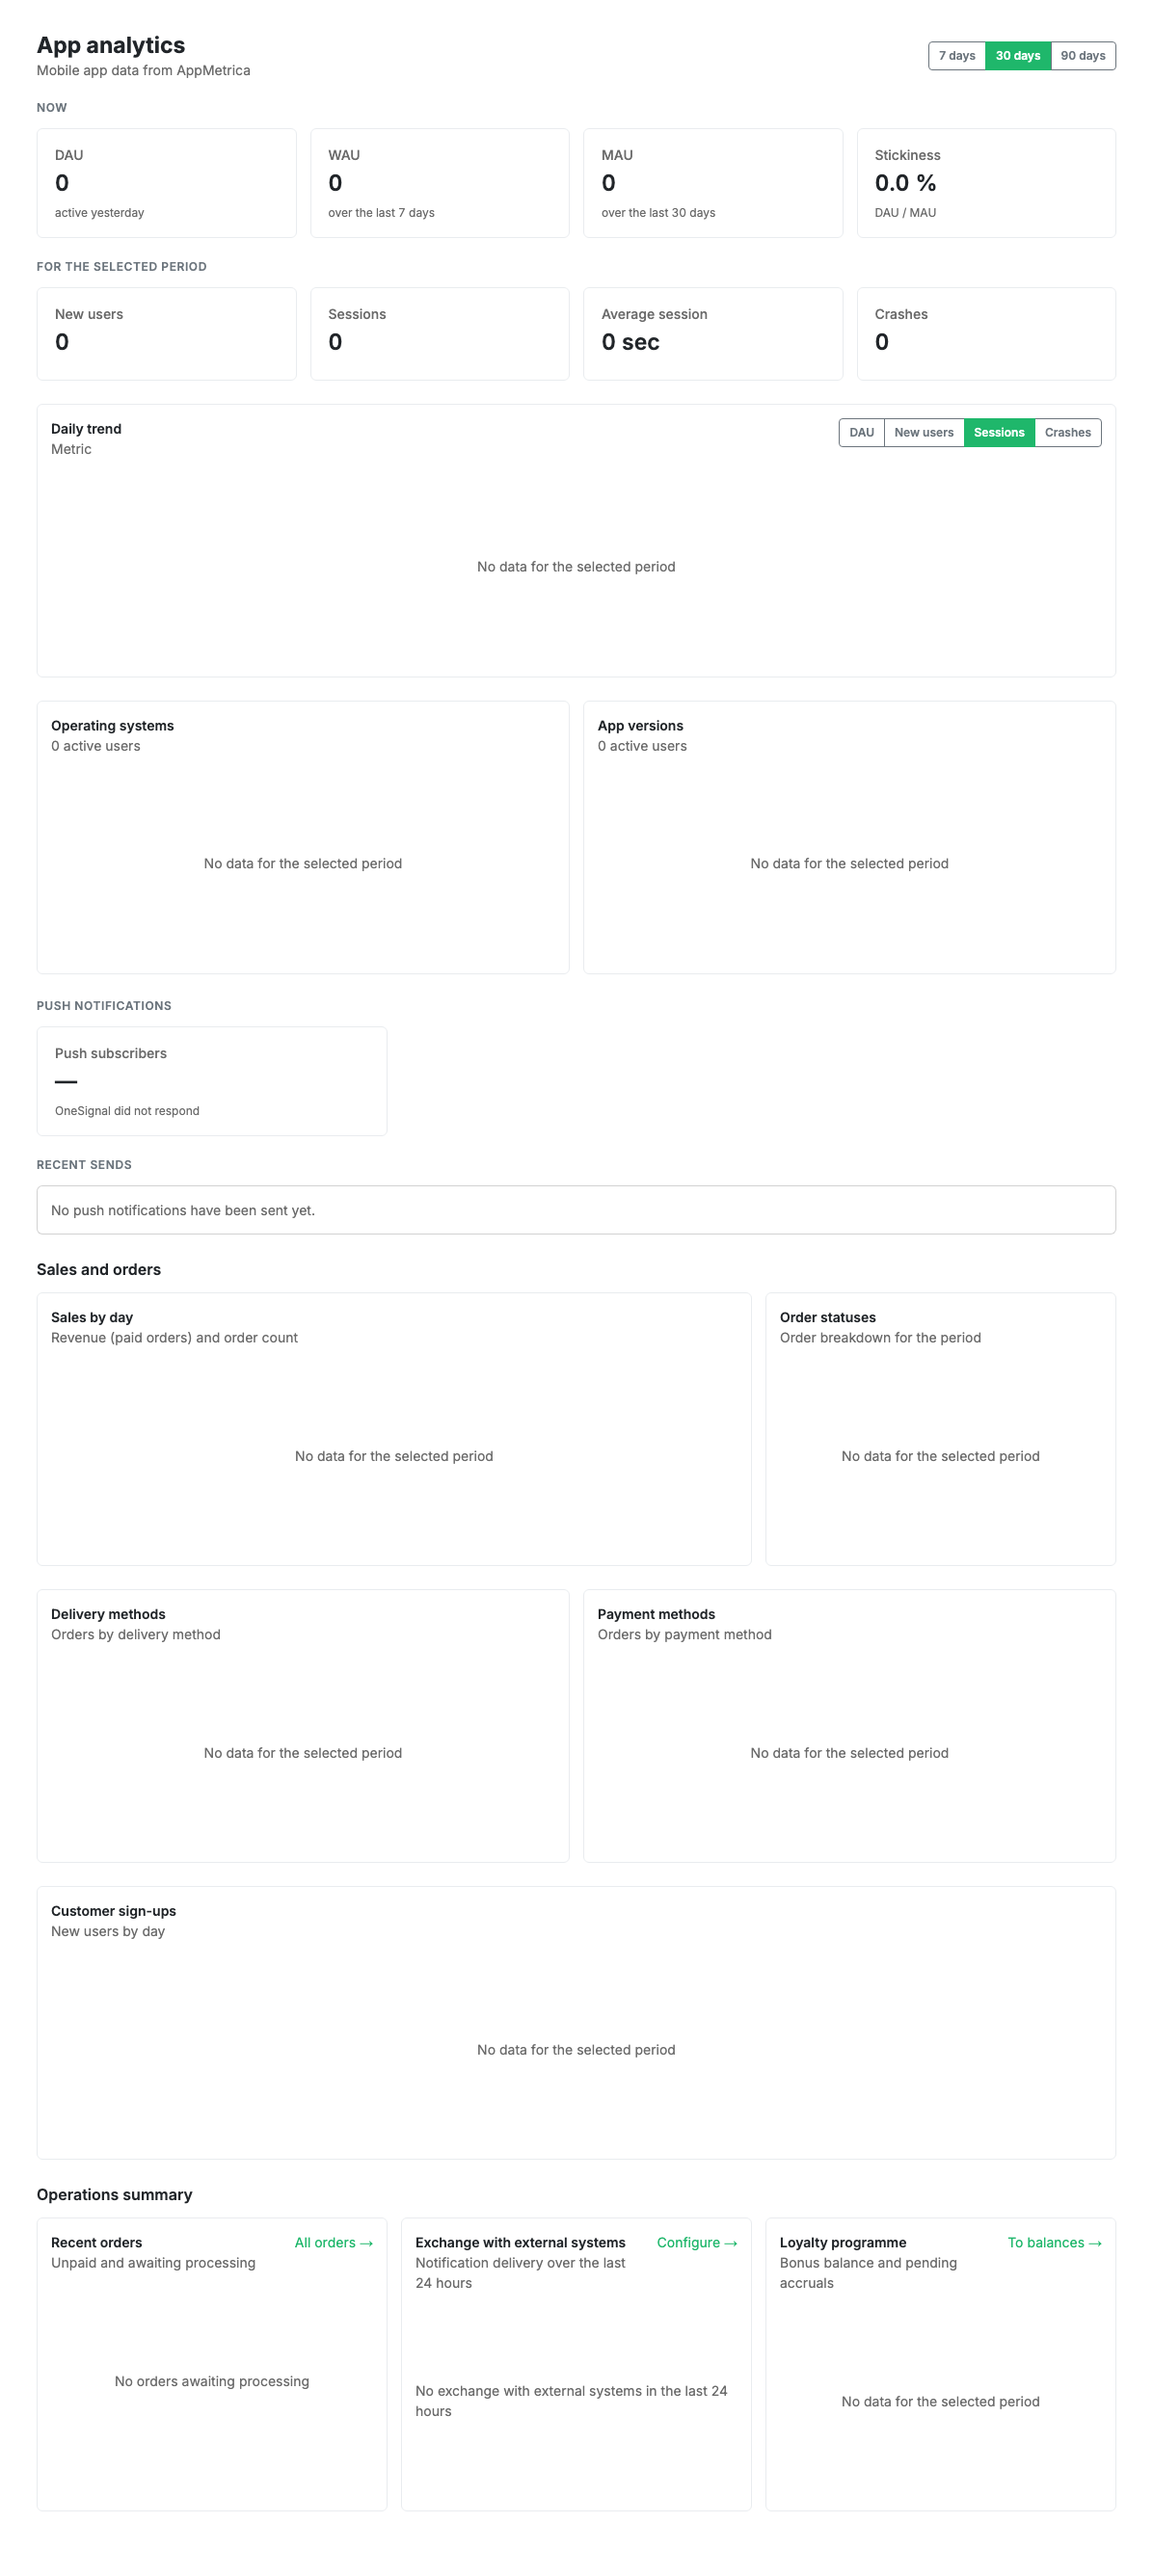
A chart of the chosen metric across the days of the period. The switch above the chart picks the metric: DAU, New users, Sessions, Crashes.
Distributions
Two cards show how active users are spread:
- Operating systems: the iOS and Android shares.
- App versions: which app versions people are on.
Each row gives a percentage and a user count. This tells you whether people update to fresh versions.
Push notifications
The block works independently of the analytics service and is visible even when the main analytics is not connected.
- Push subscribers: how many people are subscribed to notifications.
- Recent sends: a table of the last three campaigns: when they were sent, the text, how many were delivered and how many were opened.
Sales and orders
This block is built from the shop's own data and works without external services.
- Sales by day: revenue from paid orders and the number of orders on one chart.
- Order statuses: how the period's orders are spread across statuses.
- Delivery methods and payment methods: what shoppers use more often.
- Customer registrations: how many new shoppers appeared each day.
Operational summaries
Three cards at the bottom answer the question "what needs attention right now":
- Fresh orders: unpaid and waiting to be handled, with a link to the order list.
- Exchange with external systems: notification delivery over the last 24 hours, with a link to the exchange settings.
- Bonus programme: how many bonuses sit on customer balances, how many await confirmation and how many expire within a week.
States
The analytics service is not connected
If the analytics service is not connected, a card inviting you to set it up is shown instead of the report, with a button that takes you to the connection.
Two variants are possible:
- Connect the service: the integration is not configured yet.
- Finish setting the service up: the integration is connected but no app has been chosen to collect statistics for. Choose it in the integration settings.
A similar invitation appears in the Push notifications block if the push delivery service is not connected.
No data for the period
If a metric has no values for the chosen period, "No data for the chosen period" appears in place of the chart or the distribution card. That is normal for new apps and short periods.
Loading error
If the analytics service is temporarily unavailable, the warning "Could not load the data" is shown. Refresh the page later.
Limits and caveats
- Data comes from external services and can lag by several hours. Today's figures do not appear straight away.
- DAU is always counted over a single day, so in the "Right now" block it has no comparison with the period: comparing a daily metric with 30 days would be wrong.
- The Push notifications block does not depend on external analytics: if only the push delivery service is connected, campaign statistics still show.
- The Sales and orders block and the operational summaries are calculated from the shop's own data and are always shown, even when external analytics is not connected.
Related pages
- Integrations: connecting the analytics and push services